
In today’s data-rich environment, effective communication is paramount. Avoid overwhelming your audience with excessive information; instead, focus on presenting data in a clear, impactful manner. Remember the power of visuals. Just as illustrations enhanced our understanding as children, well-designed visuals can significantly improve comprehension and retention in a business setting.
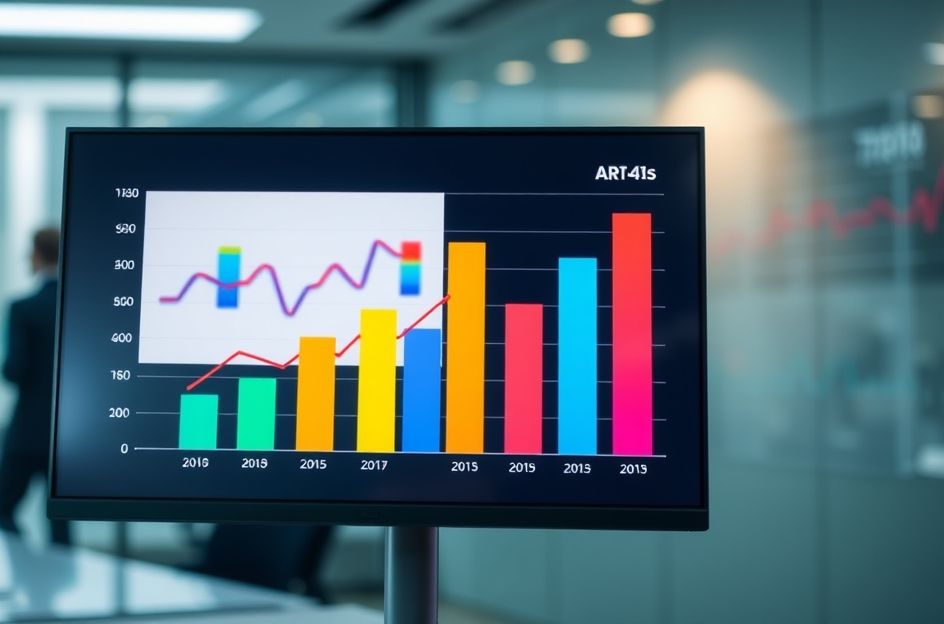
Bar graphs are invaluable tools for capturing and maintaining your audience’s attention during presentations. Unlike dense tables of numbers, bar graphs offer an immediate visual representation of key data points. For example, the tallest or shortest bar in a chart instantly draws the eye, highlighting significant highs or lows. By strategically using bar graphs, you can guide your audience’s focus and facilitate a more engaging discussion.
Beyond simply highlighting extremes, bar graphs can also effectively illustrate trends. A bar chart depicting monthly sales figures, for instance, can quickly demonstrate a consistent upward trajectory. This visual representation allows your audience to grasp the overall trend without getting bogged down in individual data points.
To maximize the impact of your bar graphs, consider the following guidelines: Clearly label all axes and bars to ensure clarity. Use vibrant colors to emphasize key data points and muted colors for less significant information. Ensure that the data presented is relevant to your presentation’s objectives. A visually appealing bar graph is only effective if it contributes meaningfully to your overall message. Finally, embrace creativity and explore different visualization techniques to keep your audience engaged. By incorporating well-designed bar graphs into your presentations, you can enhance understanding, improve retention, and ultimately deliver a more impactful message.